MAPPING THE FRACK
(in the Forest of Bowland)

Altered copy of official map from the Oil & Gas Authority – A3
(Click on image to enlarge)
This map depicts all of the zones where fracking could take place across the UK.
Indicated on the map as yellow and green coloured squares, these zones with licences for shale gas mining (and fracking) conform to the rectilinear grid and geometric coordinates of the UK’s Ordnance Survey. The boundary line that delineates permission zones adopts a grid to brutally cross the landscape, without recognition of land use or characteristics.
This map is printed backwards to encourage viewers to see the land surface from below, from an underground perspective.
Photocopy – A5
(Click on image to enlarge)
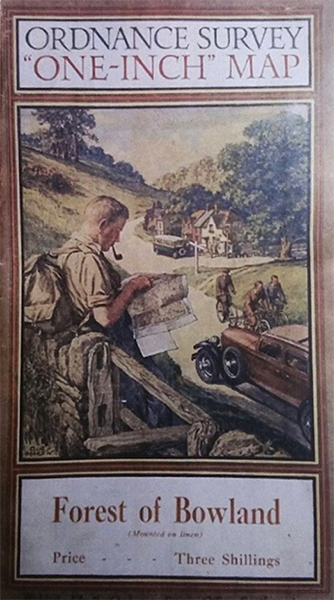
“Whilst investigating the history of the UK’s Ordnance Survey (OS) map system, I looked at how cover images of their touring map series portrayed the UK countryside as a place of recreation. Ordnance Survey Map: The Forest of Bowland 1934 depicts the cover image by artist Ellis Martin for the Forest.” Catherine Harrington

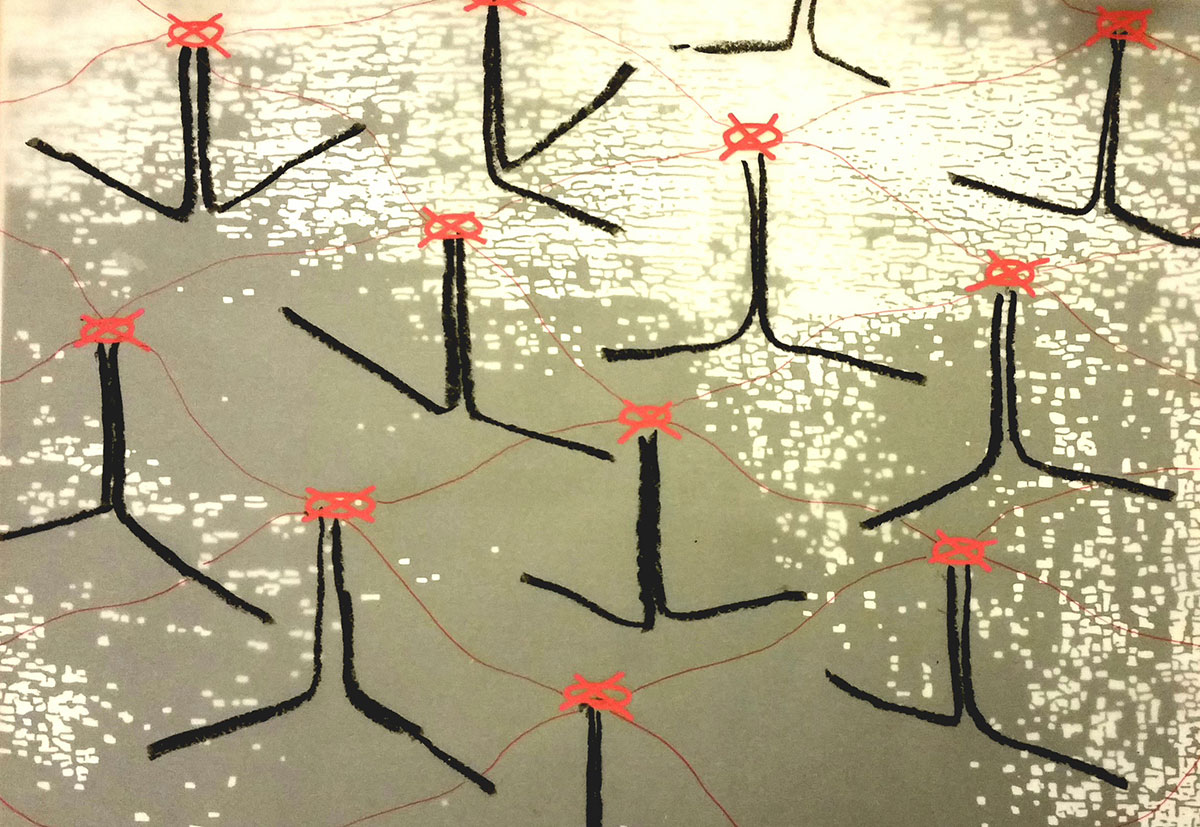
Fracking in the Forest of Bowland 1
Collage – A3; A premonition of the Forest of Bowland’s future was created through collaging Ellis Martin’s cover image with a photograph portrait of the mineheads used in fracking.

FrackingTerritory in the Forest of Bowland
Photocopy of Map of Licences to Frack in archive box – A5; A contemporary OS map shows the boundary line of the proposed fracking zone alongside the Forest of Bowland.

Fracking Border in the Forest of Bowland
Collage – A3; This image shows the arbitrary boundary line marking the terrain with permission to frack, which intersects fields and cuts through trees.
Coordinates of Fracking Conduit
Collage, pastel drawing on tracing paper; This drawing reveals the geometry of subterranean mining conduit – 2km vertically and 1.8 km horizontally.
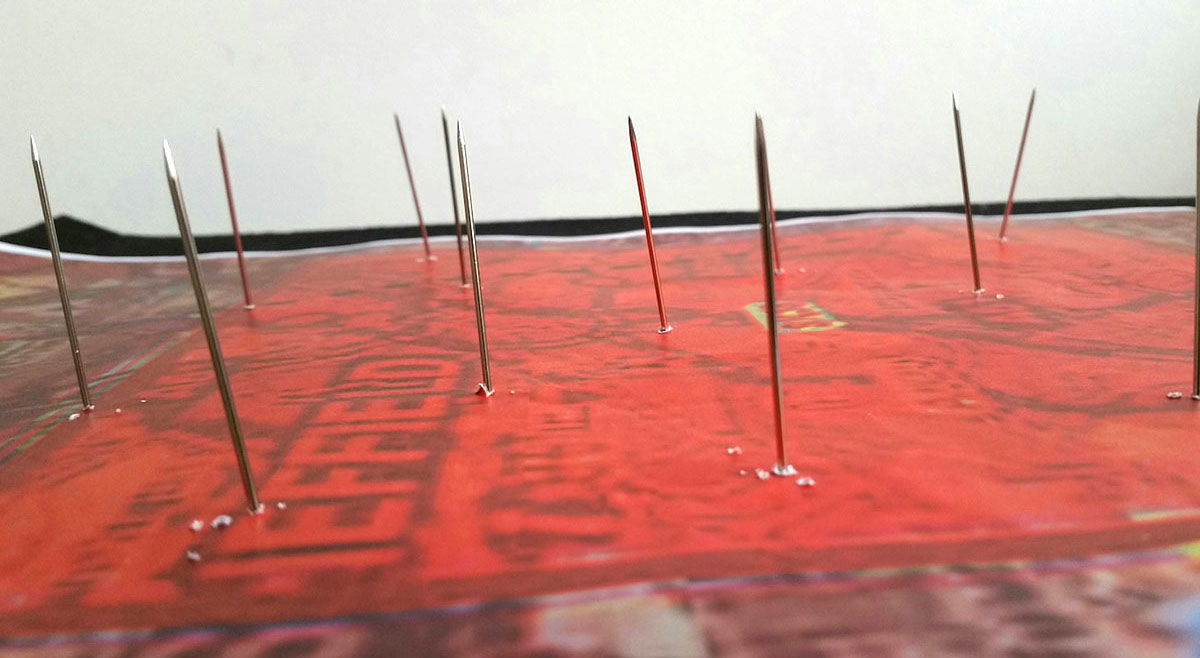
Fracking Geometry in Sheffield
Map photocopy on acetate, pins – A3; Sheffield is located in the zones with licences to drill for shale gas: this drawing indicates the minefield layout that could be installed.
Mapping the Frack
Fracked
Fracking Activity
Residual Contaminants
Protest
Click on any of the above themes to see the artwork.